According to Business Insider Singapore in May 2018, there are
28 banks in the world with $1 trillion of asset each. Of that, China is
home to the four largest in the world by asset ranked in the following order:
1.
Industrial & Commercial Bank of China (ICBC)-
$4.0 trillion (SHA: 601398, HKG: 1398, US: IDCBY)
2.
China Construction Bank (CCB) - $3.4 trillion (SHA:
601939, HKG: 0939, US: CICHY)
3.
Agricultural bank of China (ABC) - $3.24 trillion
(SHA: 601288, HKG: 1288, US: ACGBY)
4.
Bank of China (BOC) - $2.99 trillion (SHA: 601988,
HKG: 3988, US: BACHY)
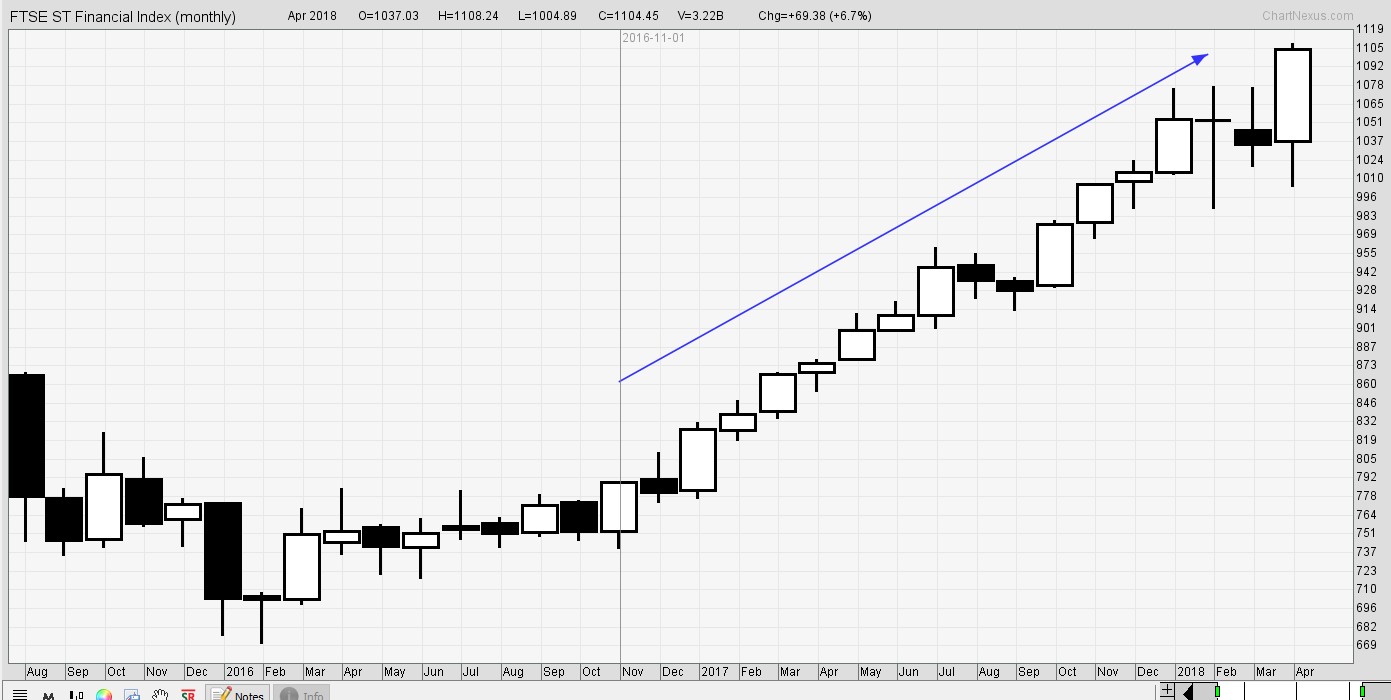
Collectively known as Big Four banks in China, their A-shares
and H-shares dual-listed in China and Hong Kong stock markets and ADR shares are available for trading in US market too. These bank
stocks had a good run since bottoming in early 2016, clocking gains of between
80% to 120% from their lows. After peaking in Jan 2018, their share prices have
correct almost 20%. With low Price-earnings ratios and high dividend yields currently, are they good bargains to buy now?
 |
| Click to enlarge |
Based on the price as of 22 Aug 2018, the valuation matrices
based on Price-earnings ratios (P/E), Price-book ratios (P/B) and dividend yields
are as follow:
 |
| (Based on H-share prices) |
Comparing Valuations based on P/E against
dividend yield:
At a glance, it appears that BOC is the cheapest (lowest
PE, highest dividend yield) among the four followed by ABC while
ICBC and CCB are trading at very close valuations.
Before deciding on which bank is the best bargain right away,
the analysis might be useful to compare the banks in terms of
profitability, asset quality and capital adequacy based on their 2017
annual results.
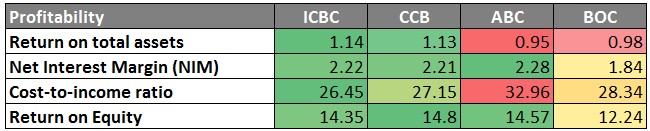
Comparison
of Profitability
Based on the above profit indicators, ICBC and CCB scored
the best. Although ABC was the best in terms of NIM (i.e. difference between Interest
Income and Interest Expense over Total value of Loans and Securities), it also
had the highest cost-to-income ratio (expenses incurred to earn that income)
and lowest return on total assets. However, ABC managed to earn relatively
higher Return on Equity (ROE), probably due to the lower common equity employed
which could be seen from the section on Capital Adequacy. Of the four, BOC had
the lowest ROE.
Comparison
of Asset Quality
A non-performing loan (NPL) is defined as a loan that is in
default or close to being in default. High NPL ratio may indicate that greater
portion of loans were made to poor credit quality borrowers. Allowance to NPL is
the amount provision made divided by the amount of NPL. A higher Allowance to
NPL indicates a bigger buffer and hence ability to absorb any sudden increase
in the NPL without immediate impact on the future profits.
From the table above, it can be seen that ABC had the
highest NPL ratio and was the most aggressive in terms of making provision for the
potential impairment losses on loans and CCB seems to be in the middle of the
extremes.
Comparison of Capital Adequacy
According to Investopedia, the Capital Adequacy Ratio (CAR)
is a measure of a bank's available capital expressed as a percentage of a
bank's risk-weighted credit exposures. Tier one capital is the capital that is
permanently and easily available to cushion losses suffered by a bank without
it being required to stop operating.
As tabulated, CCB and ICBC had the highest capital adequacy
ratios. While ABC had the lowest ratios, it may be useful to note that BASEL
III international regulatory framework only requires 8.5, 9.5 and 11.5 for the
above ratios (source DBS Research) and
all the four banks were well in excess of the minimum requirements.
What does
the market think of the valuations?
From the P/B and ROE chart above, it can be deduced that the
market is currently pricing the four PRC banks based on profitability, quality
of assets and adequacy of capital with CCB having the highest valuation awarded,
followed by ICBC, ABC and BOC in that order.
Would you pick the cheapest bank to invest or pay a higher
price for better quality?
Due to lingering fears of hidden bad loans, China banks have persistently traded at low PEs and below its book values over the past few years despite providing relatively high dividend yield.
Other articles on Banks:
Who Had Been Buying and Selling the Shares of Singapore Banks?