Translate

Showing posts with label Dividend. Show all posts

Friday, August 24, 2018

Which China bank to invest, ABC, BOC, CCB or ICBC?


According to Business Insider Singapore in May 2018, there are 28 banks in the world with $1 trillion of asset each. Of that, China is home to the four largest in the world by asset ranked in the following order:
1.       Industrial & Commercial Bank of China (ICBC)- $4.0 trillion (SHA: 601398, HKG: 1398, US: IDCBY)

2.       China Construction Bank (CCB) - $3.4 trillion (SHA: 601939, HKG: 0939, US: CICHY)

3.       Agricultural bank of China (ABC) - $3.24 trillion (SHA: 601288, HKG: 1288, US: ACGBY)

4.       Bank of China (BOC) - $2.99 trillion (SHA: 601988, HKG: 3988, US: BACHY)

Collectively known as Big Four banks in China, their A-shares and H-shares dual-listed in China and Hong Kong stock markets and ADR shares are available for trading in US market too. These bank stocks had a good run since bottoming in early 2016, clocking gains of between 80% to 120% from their lows. After peaking in Jan 2018, their share prices have correct almost 20%. With low Price-earnings ratios and high dividend yields currently, are they good bargains to buy now?

Click to enlarge
Based on the price as of 22 Aug 2018, the valuation matrices based on Price-earnings ratios (P/E), Price-book ratios (P/B) and dividend yields are as follow:
(Based on H-share prices)

Comparing Valuations based on P/E against dividend yield:

At a glance, it appears that BOC is the cheapest (lowest PE, highest dividend yield) among the four followed by ABC while ICBC and CCB are trading at very close valuations.

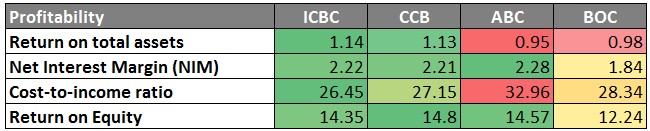
Before deciding on which bank is the best bargain right away, the analysis might be useful to compare the banks in terms of profitability, asset quality and capital adequacy based on their 2017 annual results.

Comparison of Profitability


Based on the above profit indicators, ICBC and CCB scored the best. Although ABC was the best in terms of NIM (i.e. difference between Interest Income and Interest Expense over Total value of Loans and Securities), it also had the highest cost-to-income ratio (expenses incurred to earn that income) and lowest return on total assets. However, ABC managed to earn relatively higher Return on Equity (ROE), probably due to the lower common equity employed which could be seen from the section on Capital Adequacy. Of the four, BOC had the lowest ROE.

Comparison of Asset Quality


A non-performing loan (NPL) is defined as a loan that is in default or close to being in default. High NPL ratio may indicate that greater portion of loans were made to poor credit quality borrowers. Allowance to NPL is the amount provision made divided by the amount of NPL. A higher Allowance to NPL indicates a bigger buffer and hence ability to absorb any sudden increase in the NPL without immediate impact on the future profits.

From the table above, it can be seen that ABC had the highest NPL ratio and was the most aggressive in terms of making provision for the potential impairment losses on loans and CCB seems to be in the middle of the extremes.

 Comparison of Capital Adequacy


According to Investopedia, the Capital Adequacy Ratio (CAR) is a measure of a bank's available capital expressed as a percentage of a bank's risk-weighted credit exposures. Tier one capital is the capital that is permanently and easily available to cushion losses suffered by a bank without it being required to stop operating.

As tabulated, CCB and ICBC had the highest capital adequacy ratios. While ABC had the lowest ratios, it may be useful to note that BASEL III international regulatory framework only requires 8.5, 9.5 and 11.5 for the above ratios (source DBS Research) and all the four banks were well in excess of the minimum requirements.

 What does the market think of the valuations?


From the P/B and ROE chart above, it can be deduced that the market is currently pricing the four PRC banks based on profitability, quality of assets and adequacy of capital with CCB having the highest valuation awarded, followed by ICBC, ABC and BOC in that order.
Would you pick the cheapest bank to invest or pay a higher price for better quality?

Due to lingering fears of hidden bad loans, China banks have persistently traded at low PEs and below its book values over the past few years despite providing relatively high dividend yield.
Other articles on Banks:
Who Had Been Buying and Selling the Shares of Singapore Banks?

Connect @ Facebook

This is not a buy or sell recommendation. Please do your own due diligence before making any investment decision. Read Disclaimer

Saturday, February 24, 2018

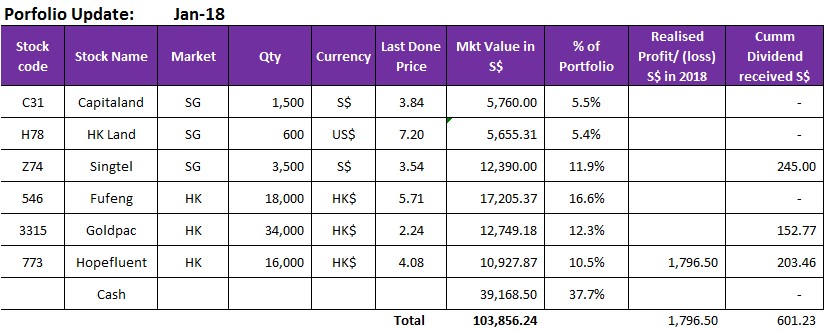
Stock Sniper's Portfolio For January 2018


Read about Stock Sniper's Portfolio HERE


The opening month of 2018 saw quite a bit of activities in this portfolio, with two new stocks added, increased exposure in one current holding and partial profit taking in another. 
Higher cash amount had been deployed and the cash position fell to below 40% of total portfolio.
 
Transactions done in Jan 18:

1. CapitaLand Limited
 
Initiated new position.
 
CapitaLand Limited is one of the Asia's largest real estate companies based in Singapore. Quick analysis of the company can be found HERE.
 
With the expected pick up in the economies around Asia, property sector may be one of the beneficiaries. Singapore private property market which has been subject to Government's cooling measures has also shown signs of improving sentiments. While China residential property market has also been under Government's control measures, share prices of property stocks have rallied strongly recently on sales optimism and expectation on relaxation of cooling measures.


CapitaLand, having strong presence in both markets (83% of total assets), has been trading near multi-year low valuation in terms of PE and Price over book value. Moreover, CapitaLand has been growing its recurring income from investment properties (85% of total assets are contributing to recurring income as at Sept 17) and have recently increased its dividend payout which appears to be sustainable.

With improving outlook and sentiment, CapitaLand could trade closer its historical mean of 1 to 1.1x its book value which is currently at $4.29 as at Sep 17, i.e. fair value of $4.29 to $4.70. 

At the purchased price, dividend yield of 2.7% is pretty decent.

Risks:
1. Property business, especially residential property development can be quite cyclical, subject to the health of the economy as well as Government's policies.
2. Rising interest rates might increase the financial burdens of property companies with high gearings, adversely affect capitalization rates used for property valuations and dampen buyers' appetite for properties.
 
 
2. Hongkong Land Limited

Initiated new position.

Founded in 1889, Hongkong Land is a listed leading property investment, management and development group.  The Group owns and manages almost 800,000 sq. m. of prime office and luxury retail property in key Asian cities, principally in Hong Kong and Singapore.
Its Hong Kong Central portfolio represents some 450,000 sq. m. of prime property. It has a further 165,000 sq. m. of prime office space in Singapore mainly held through joint ventures, and a 50% interest in a leading office complex in Central Jakarta. The Group also has a number of high quality residential and mixed-use projects under development in cities across Greater China and Southeast Asia, including a luxury retail centre at Wangfujing in Beijing. In Singapore, its subsidiary, MCL Land, is a well-established residential developer. Majority of its assets are investment properties producing recurring income.

The investment thesis for Hongkong Land is almost the same as CapitaLand, at current price, HK Land is trading at huge discount to its book value of more than 50%, dividend yield of about 2.7%. 


Based on its half year announcement, Hongkong Land is expecting a "solid" full year performance.
 

3. Fufeng Group 

Increased position.

The share price had experienced quite a bit of volatility at the beginning of Jan, which may be due to the raise in corn prices in China since last quarter. There were reports that the China state grains stockpiler had started to sell corns from its stockpiles to meet demands and also China imports from USA and Ukraine, and this could moderate the price increase.

As corn is the major cost component in Fufeng's business, it is worthwhile to keep a close tab on its market outlook.


3. Hopefluent 
 
Taken partial profits.

In late Jan, Hopefluent announced a Framework agreement with another large SSE listed property co, Poly Real Estate Group (RMB201B mrk cap) with both companies transferring their the primary & secondary real estate agency business to a new JV. Under the Framework, Hopefluent shall hold 55 - 65% of the JV and Hopefluent shall issue 5% new shares to this partner at HK$4.20 to strengthen the cooperation. This agreement is still subject to the completion of due diligence expected by May 18.

My initial thoughts
1. There is potentially more primary business from new property launches from this big property developer
2. Removed direct competition in the primary and secondary real estate agencies with Poly Real Estate Group upon completion of the deal
3. Hopefluent will be flooded with even more cash from this new share issuance!


The market got excited on this news in the next trading day and the share price jumped more than 12% to as high as HK$4.60 before closing at HK$4.16.

While the ex-cash valuation of Hopefluent at current price is still not demanding, the exposure to property sector in this portfolio has increased substantially after adding CapitaLand and Hongkong Land and I deemed an adjustment was necessary. Therefore, I took the opportunity of share price spike to realize some profits on this investment made in Aug-Sep 17, netting an average gain of more 30% (or than more than 60% gain on an annualized basis), not counting the dividend received.
 
(Refer to previous postings on this company HERE)
 
News Review for the rest of Portfolio companies during the month:

Goldpac:

Readers might recall that I had written about Goldpac being hit by exchange losses due to  currency translation of its huge USD balance as RMB strengthened against USD during the half year period end Jun 2017.

In the previous financial year, it was reported that approximately 49% of Goldpac's huge cash hoards were in USD & HKD.

If its currency exposure remained the same without hedging done, with continue weakening of USD (note that HKD is also pegged to the USD) since Jun 17, it should not be a surprise that Goldpac would suffer greater exchange losses in the 2nd half period as USD continued to weaken against CNY

In Jan 18, Goldpac was honored with "Best Value TMT Company” for Golden HK Stock Award, 2017.
 
(Refer to previous postings on this company HERE)


Connect @ Facebook

Read Disclaimer

Wednesday, January 10, 2018

Capitaland Limited: Quick Takes


The underlying sentiments towards Singapore residential and commercial property markets has been getting increasingly positive.

On 4th Jan 2018, The Strait Times published an article titled Property market finally on the upturn. In that article, analysts were quoted saying that after three years of falling prices, 2018 is looking like the year that the Singapore property market's long-awaited turnaround finally gains traction.

In another news article dated 3rd Oct 2017, Tide has turned for office market, say analysts, the industry watchers are predicting an office rental recovery as the supply of new completions dwindles.
Here, we shall take a quick look at some of key matrix of Capitaland.

Corporate Profile

CapitaLand is one of Asia’s largest real estate companies. Headquartered and listed in Singapore, it is an owner and manager of a global portfolio worth more than S$78 billion as at 31 December 2016, comprising integrated developments, shopping malls, serviced residences, offices, homes, real estate investment trusts (REITs) and funds. Present across more than 130 cities in over 20 countries, the Group focuses on Singapore and China as core markets, while it scales up presence in markets such as Vietnam.

2016 Statistics


CapitaLand’s competitive advantage is its significant asset base and extensive market network. Coupled with extensive design, development and operational capabilities, the Group develops and manages high-quality real estate products and services. It also has one of the largest investment management businesses in Asia and a stable of five REITs listed in Singapore and Malaysia – CapitaLand Mall Trust, CapitaLand Commercial Trust, Ascott Residence Trust, CapitaLand Retail China Trust and CapitaLand Malaysia Mall Trust.

(Source: Capitaland Annual Report)

Financial Numbers


Revenue and net profits have been growing steadily over the period despite multiple property cooling measures being implemented in its key markets of Singapore and China. This demonstrates the management and business resilience of Capitaland.


Its book values also have been increasing over the years from the retained profits and appreciation of its investment properties. The slight dip in 2016 was due appreciation of SGD against GBP, RMB and MYR.


Dividends

In line with its policy to grow core dividend on a sustainable basis, Capitaland has been rewarding its shareholders with increasing regular dividends over the years,. At the current share price, its dividend yield is about 2.7%.


From the chart above, it can be seen that the current share price of Capitaland is trading at low points of the Price Earnings and Price/Book ratios despite improving financial results over the period since 2010.


From its Q3 2017 results, the 9 months profits attributable to owners of Company has reached S$1.283 billion, exceeding the annual profit of 2010 and is the highest profit level since 2007. However, the share price still has not managed to break above the highs of 2010 and 2013 post financial crisis.              


In early Jan 17, Capitaland announced disposal of 20 malls located in the Tier 3 China cities worth S$1.71 billion with a net gain of S$75 million, to focus on the Tier 1 and Tier cities. Stock brokers cheered this move and some of them have upgraded their target share price for Capitaland as follows:


Stock Broker
Target Price
CIMB
4.25
OCBC
4.13
RHB
4.20
DBS
4.35
Average
4.23

Technical View


Technically, Capitaland has recently broken both above its short term down trend and resistance at $3.75 and may consolidate near this level for a while before deciding next move. 

Are there more legs to its upside?


Friday, October 20, 2017

Dividend: Romance Of The Three Telcos – Singtel, Starhub & M1


Telcos have been the traditional favourite investment choice for many dividend investors.
Since the news of the 4th Telco entry and the potential heighten competition from Netflix on the pay-TV segment, share prices of the existing 3 listed telcos in Singapore have not been doing well, particularly from September 2016.

From January 2016 to October 2017, the share price of M1 & Starhub have retreated by more than 30% and 24% respectively while Singtel is relatively resilient, edging up by 6.2%


Investing in Singapore Telcos

Without delving into their operational performances and speculating about the future, let’s run some quick trailing twelve month (TTM) numbers to see how each Telco stacks up against one another.

Company
Share Price
Dividend
(cts)
Dividend yield
EPS
(cts)
PE
ROE
P/B
Debt/ Equity
*Dividend payout ratio
*Free cashflow/ share cts)
Singtel
3.76
17
4.5%
23
16.3
14%
2.1
0.34
74.8%
11.93
Starhub
2.68
19
7.1%
17
15.8
96%
11.7
2.48
110%
5.19
M1
1.785
11
6.2%
14
12.8
35%
4.3
1.15
77.6%
10.76
Reference: MorningStar dated 19 Oct 17                       
* Indicates calendar year-end data information

In terms of financial matrices, it seems that Starhub scored the worst among the three due to its highest debt ratio and dividend payout ratio exceeding both EPS and free cashflow. This implies that the current rate of dividend payment might not be sustainable for Starhub.
Conversely, Singtel has the strongest balance sheet (lowest debt ratio) and while its PE seems to be the highest, its Price-over-Book ratio is the lowest among the three telcos. So it would mean the price that the investors are paying for Singtel are backed by more assets. Also, Singtel has the headroom capacity to gear up its balance sheet further should it need to and still could maintain its dividend payment (note that Singtel’s free cashflow/share for FY17 was 17.36cts and in the current period, it has received S$1.1bil in proceeds from Netlink IPO)

In conclusion, it seems that the financials of Singtel is rather strong and it has probably the best ability to sustain its current dividend among the three telcos.

On another side note, all three companies have engaged in share buy-backs as their share prices declined over 2016 - 2017. Let’s us take the hindsight view of the outcome:


Interestingly, despite larger amounts spent on buy-backs, the share prices of M1 and Starhub continued to decline further. M1 which utilized the highest amount of S$28M on share purchases, saw its share price still decline 26% below its average price paid. For this year, Starhub seems to have “thrown in the towel” and stopped buying back its shares to-date 2017 while Singtel actually increases its share buyback this year, but spending a modest amount of only S$4.7M vis-à-vis its market capitalization (probably main purpose of Singtel's buy backs is for its employee stock option scheme?).  

Monday, July 31, 2017

Goldpac: Is There Gold in Goldpac?


  Goldpac Group Limited
  3315 HK


Goldpac's origin can be traced to 1993 when the founder, Lu Run Ting, started the business to provide financial cards to banks. In 1995, it commenced its first operating centre in Zhuhai. In 1999, its first card personalization centre in China was opened during which Gemalto, a global leader in digital security solutions, became a strategic investor with a substantial stake in the firm.

In 2005, Goldpac became the first company to produce the first EMV (Europay MasterCard Visa) card issued in China. As an early player in the financial card industry in PRC, today Goldpac is the only card manufacturer in China that is certified by all the 6 leading card issuance organisations (Visa, Mastercard, Amex, Unionpay, Diners, JCB).
 
 
In late 2013, Goldpac launched its IPO in Hongkong Stock Exchange, offering new 200M shares at price of HK$5.39, raising more than HK$1B.
 
Since the establishment of the Group, it has developed expertise in the business of card manufacturing and providing card production solutions relating to these products. Currently, the business primarily consists of two segments, namely,
 
(i)  Embedded software and secure payment products
 - Embedded software and secure payment products for smart secure payment
(ii) Platform and service
 - Provision of personalisation service, system platforms and other total solutions for customers in a wide business range including financial, government, healthcare, transportation and retails by leveraging Innovative Fintech


 According to 2016 annual report, it is the market leader in China with a market share of 15% of China UnionPay IC Card Shipment. It is also the world’s 4th largest supplier of payment card with chips in 2015, according to the Aug16, Nilson Report.
 
Driven by the high growth of China's economy and ongoing migration from magnetic strip cards to smart cards (such as EMV) for better security and functionality, Goldpac was able to enjoy rapid growth in its business in years prior to 2015. Due to the stringent security, qualification and certification requirements, this industry can be said to have high barrier to entry. Goldpac's customers are mainly financial institutions.
(Source: Zhitongcaijing) 

However, initiatives taken by China government in first half of 2016 to rectify and regulate the Internet financial market, especially irregularities involving third party payments, has pushed the banking industry into improving its risk management and slowdown in both the IC card migration and growth of the payment card. Coupled with the deceleration of China's economic growth, Goldpac reported its post-IPO declines of sales by 17% and net profit by 15%.


Recently, the emergence of mobile payments and rapid growth ewallets such as Alipay, WeChat Pay in China has casted a dark shallow in the minds of the investors on the relevance of physical bank debit and credit cards producers such as Goldpac .


With all these negative factors lingering, the share price of Goldpac took a big hit and tumbled from the historic high of HK$9.50 in 2014 to below HK$2 in late 2016.
  
While  it is understandable that the China Government regulation of the internet banking and payment is aimed at providing a more secured and orderly growth of the banking industry in the longer term, are the substitution threats from mobile payment such as ewallets, as well as P2P ecommerce and NFC (Near field communication) devices going to eliminate the use of bank cards, in particularly the credit cards?

Without doubts, the rise of the different types of internet & mobile payments will provide an array of different payment modes that the consumers can choose from, which will help to accelerate the transition into a cashless society. More importantly, these new payments modes are currently not targeted to replace an important function of the credit card, at least not at this moment, that is, to provide the CREDIT (lending) function in the payment process.  

In addition, debit and credit cards are not only used to facilitate payments, they also serve as a marketing tools for the banks, clubs and merchants, by portraying income and status differentiation via the criteria used for qualifying each type of credit cards (in Singapore context, e.g. OCBC Premier card, DBS Treasures, UnionPay Diamond,  UOB Professional Platinium). It is also used for branding, promotion of loyalty and group identity, local examples are M1,Takashimaya, Metro, Esso Mobil, SIA, NTUC, NUS Alumni card).

Currently, the credit card penetration rate in China is still very low at less than one card per capita. The low penetration rate provides ample opportunities for expansion as China's middle class size  and urbanization continues to grow. Since Apr 2015, China allow VISA and MasterCard to clear domestic China payments which might promote further growth in credit cards market as these two card networks expand in China.

Outside China, the continued globalisation of RMB, accelerated overseas expansion of China UnionPay & China banks may also provide growth impetus for credit cards. The on-going migration to EMA compliant card in Asia is yet another avenue for card providers to grow. To capture these opportunities, Goldpac has set up operations in both The Philippines and Singapore recently. 
 
Goldpac has also won numerous awards over the years. For example, in 2016 & 2017, it was awarded:
  • China Securities Golden Bauhinia Award – the Best Listed Company in Technology Innovation
  • Best Employer Award for Three Consecutive Years since 2014
  • Innovation Award at China Soft Expo for Goldpac GCaaS for second consecutive year
  • Winner of seven ICMA Elan Awards for categories such as Unique Innovation, Best Secure Payment Card, Best Personalization & Fulfillment, The People's Choice Award, based on the ballots as cast by ICMA EXPO delegates & Loyalty, Promotional and Gift Cards  
 
Notably, ICMA Elan Awards casts a spotlight on the best of the best in the global card industry, honoring world-class achievements in both card design and technological innovation. Widely acknowledged as the most recognized award platform, the Elan Award is the Oscar’s equivalent for card development excellence. In 2017, Goldpac was honored for awards in five categories out of a total of seven. The Elan Awards recognition demonstrates Goldpac’s commitment to design quality and technical advances that drive the future of the global card industry, and is a testament to Goldpac’s technology leadership and ability to innovate.  

As a matter of fact, Goldpac has been increasing its investments in R&D over the years and in 2016, it invested about 7% of its sales revenue on secured payments, wearable product lines that cover payment jewelry, GPS, payment watches & payment wristbands and is now actively developing its Fintech capability. In 2016, it was honored with the Innovation Award at the 20th China International Software Expo (China Soft Expo) for its GCaaS cloud platform.

Goldpac's GCaaS platform integrates four key modules: Cloud Operations, Cloud Lab, Cloud Payment and Cloud TSM (Trusted Service Management), enabling a onestop solution for e-commerce, data task processing and smart card applications. These services are targeted at global card issuers, merchants and cardholders and other one-stop shop capabilities such as e-commerce, integrated business management, centralized data task processing as well as smart card application services. 
 
Other than being recognized as an innovator, Goldpac has also been recognized as being "shareholder friendly" by winning 2016 Golden Hong Kong Stock Awards, the Best Shareholders' Return & the Best Social Responsibilities. Since its listing in 2013, Goldpac has been increasing its dividend payments to shareholders at a CGAR 52%, and a total of HK$390M in dividends has been paid during the period.  

 Valuation:
(Based on December 2016 Financial statements)

Share price as at 28 July 2017: HK$2.56.
Exchange rate RMB/HKD: 1.16

1. Financial Position
Net Cash Value per share: RMB2.12 or HK$2.46
Net Book Value per share: RMB2.25 or HK$2.61
 
2. Discounted Earnings Method
(using discount rate of 4% for 10 years)

Base Case:
(a) assuming zero growth: HK$2.59
(b) assuming 5%p.a. growth: HK$3.20
 
3. Relative Valuation Method
The table below compares various financial matrix between Goldpac and its close competitor, Hengbao Co. Ltd. (002104) listed in Shenzhen Stock Exchange.
 

Clearly, Goldpac is trading at a much lower valuation than Hengbao, although it has superior net profitability, ROE and no debts.

Note also that under the negative factors described above, Hengbao had suffered a revenue decline of 26% and profit drop of 61% in 2016 as compared to a more moderate decrease of 17% and 15% for Goldpac. This could show that Goldpac is more resilient in managing its business.

Based on the discussion above, Goldpac should in fact justify a higher PE valuation than Hengbao given Goldpac's leadership position in China. Assuming using a exaggerated 70% discount to Hengbao's PE of 49.6x, we should derive a PE of 15x for Goldpac or a share price of HK$4.35.
 
Growth Catalysts:
 
1. Increase in credit card issuance in China market as credit card adoption rate increases as well as entry of foreign players such as VISA & Master Card into China market

2. Further inroads into foreign markets through the Road and Belt initiatives of UnionPay and PRC banks

3. Continue migration to EMA cards in overseas markets

4. Increase adoption rate of PRC banks using Goldpac Fintech solutions 

5. Take-off in sales for wearable payment products

Risks:

1. Intensification of competition among the existing domestic players during bidding for financial card shipments resulting in lower pricing and profitability 

2. Regulatory changes that might affect the financial card issuers

3. Slow down of China economy and consumer market

4. New payment technologies, such as NFC or even virtual credit cards, that could reduce demand for physical financial cards as a payment method

5. Competition from P2P lending and other Fintech products  that might reduce the demand for credit cards as the source of lending

Conclusion:

So is there gold in Goldpac?

The valuation of Goldpac looks undemanding, considering that it is trading at near its cash and book values.

When compare to its close competitor, Hengbao, which is listed in Shenzhen Stock Exchange, Goldpac looks much like an undervalued bargain especially with a mouth-watering dividend yield of 6.6%p.a.


From the above table, based on the different assumptions used for valuing Goldapac, we get a discount to current share price of ranging from 1.2% to 67.2% or an average discount of 21.4%. 

In July 2017, Goldpac announced that its first half 2017 smart card shipments saw an uplift of 10.6%, to 91.392 million units (82.621 million units in H1, 2016) and a 38% year-on-year surge in credit card shipments. Is this the start of the earnings recovery for Goldpac? Its half year report card for 2017 will be keenly watched.
 
For new posting alert on this blog, please click on the link below:
Subscribe to Hunting For Value by Email
 
   
New Posts:


Connect

Featured Post

Launch of Stock Sniper's Model Investment Portfolio

Please read the disclaimer before you proceed with the rest of the article. This portfolio is a mock-up model to test the investment thes...